Run and debug a Symbian application in CLion
CLion's GUI Run starts the SDK supervisor, which builds the current source, publishes its E32 image and launches a fresh disposable EKA2L1 instance. EKA2L1 is the emulator that runs the guest Symbian executable and exposes an ARM GDB connection for source debugging. GUI Debug uses that connection; the host debugger for the launcher is a different profile.
The saved configurations appear in the IDE toolbar once configure-ide has
generated the local project settings:
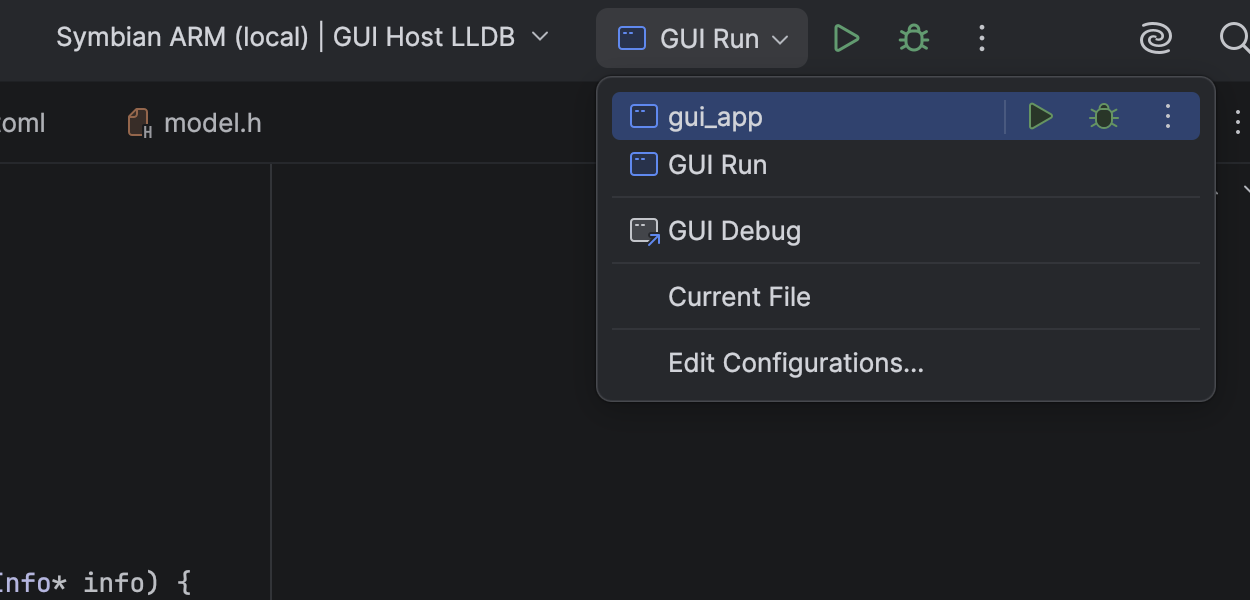
Choose GUI Run to launch the guest through the supervisor. Choose
GUI Debug for the guest GDB connection. The gui_app entry is the ordinary
CMake target and has a different role.
Run the counter
- Load the ARM CMake profile in the
examples/gui_appproject and import compatible firmware. A named ROM/Z fixture is required for this workflow. - Run
symbian emu configure-idefrom the repository root if the saved configurations are absent. Reopen the project to load the generated.ideasettings. - Select GUI Run and press Run. The configured executable is the host
supervisor, not
gui_app.elf. It builds and checks E32 before launching the guest in a disposable emulator instance. - In the emulator, tap the counter controls, then use the guest Exit
control. CLion's Stop button ends only this owned frontend. The run keeps
logs and input/binary digests beneath
.symbian/gui-runsfor inspection.
Stop at a guest source line
- Put a breakpoint in
mainorDrawGuiin the GUI source. - Select GUI Debug and its Symbian GUI GDB native debug profile. The host debugger follows the native launcher and cannot stop in ARM guest C++. The screenshot shows macOS GUI Host LLDB; Linux may have GUI Host GDB instead. Guest debugging uses Symbian GUI GDB on either host.
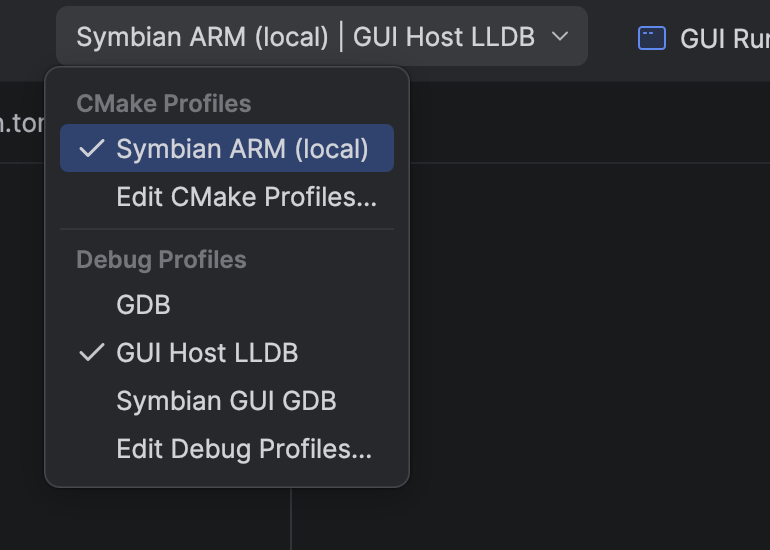
The debug profile selector is separate from the GUI Run/Debug configuration
selector. This capture still has host LLDB selected; switch to Symbian
GUI GDB before guest debugging.
3. Press Debug. The supervisor publishes the current E32, starts a halted
instance and waits for the emulator's loopback GDB stub. The saved Remote
Debug configuration connects to 127.0.0.1:24689.
4. Resume execution in the IDE. The GDB hook relocates symbols after the
guest process maps, so source breakpoints can resolve to its actual load
address. Inspect variables and step through the guest; Stop cleans up the
owned emulator child.
Guest stack unwinding can be incomplete. If the debug profile is
missing, reopen the GUI project after running configure-ide. If the port is
busy, stop the conflicting session before starting another; the supervisor
rejects a busy port rather than attaching to an unrelated process.
JetBrains' Remote Debug guide explains CLion's debugger fields. The repository's generated settings supply its symbol file, source mappings and guest GDB selection for this example. The advanced CLion guide shows the manual path when you need to inspect those pieces individually.